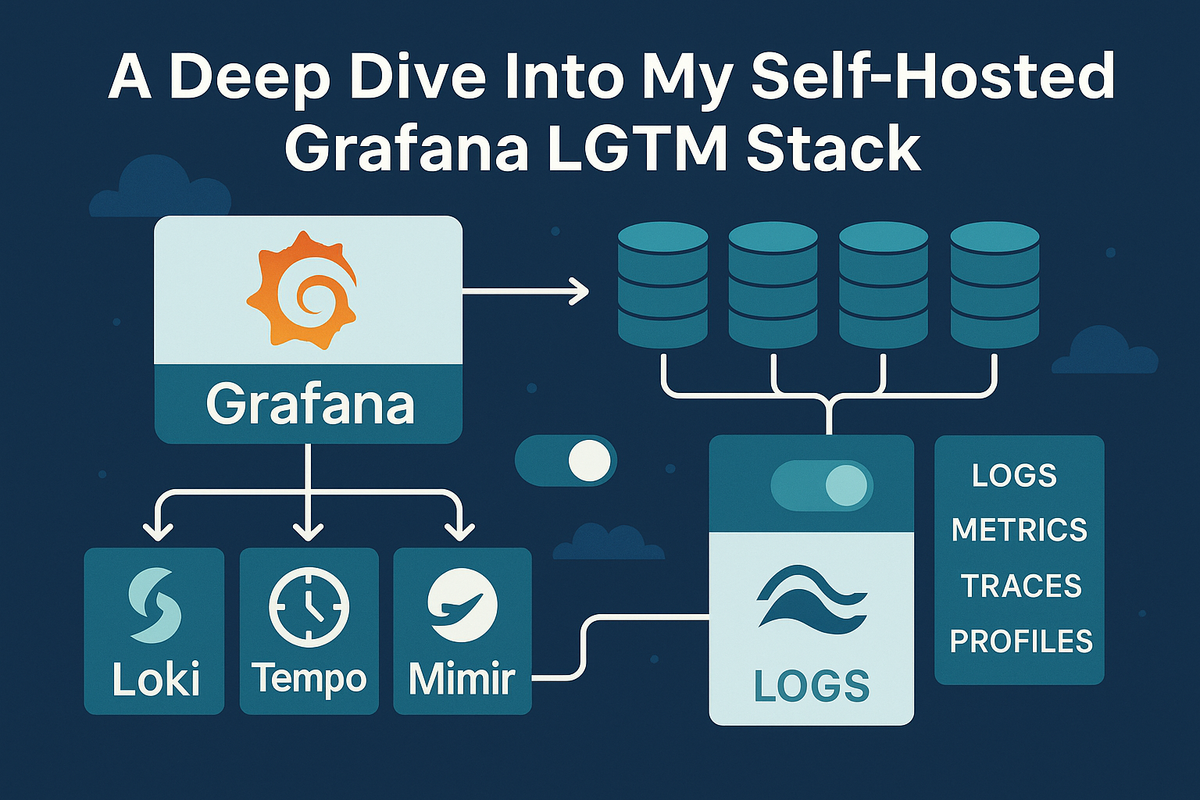
A Deep Dive Into My Self-Hosted Grafana LGTM Stack
From setup to dashboards — a hands‑on guide to running Grafana, Loki, Tempo, and Mimir in a self‑hosted LGTM observability stack.
After spending what felt like countless hours wrestling with configs, I've finally wrangled my self-hosted observability stack into a state I'm happy with. This is a walkthrough of my Grafana "Looks Good To Me" (LGTM) stack, built on a single TrueNAS node. It's designed to be a comprehensive solution for collecting metrics, logs, traces, and profiles from all my services.
This setup is powerful and flexible, but be warned: it is not a simple one-click install. If you're looking for a quick and easy solution, a platform like SigNoz might be a better fit. But if you're like me and enjoy the challenge of building a custom, deeply integrated system from the ground up, then let's dive in.
The Big Picture: Architecture Overview
The core of this stack consists of Grafana, Loki, Tempo, Mimir, and Pyroscope, with Grafana Alloy acting as the central nervous system. At a high level, the roles are simple:
- Loki: For logs.
- Mimir: For metrics.
- Tempo: For traces.
- Pyroscope: For continuous profiling.
- Grafana: The single pane of glass to visualize it all.
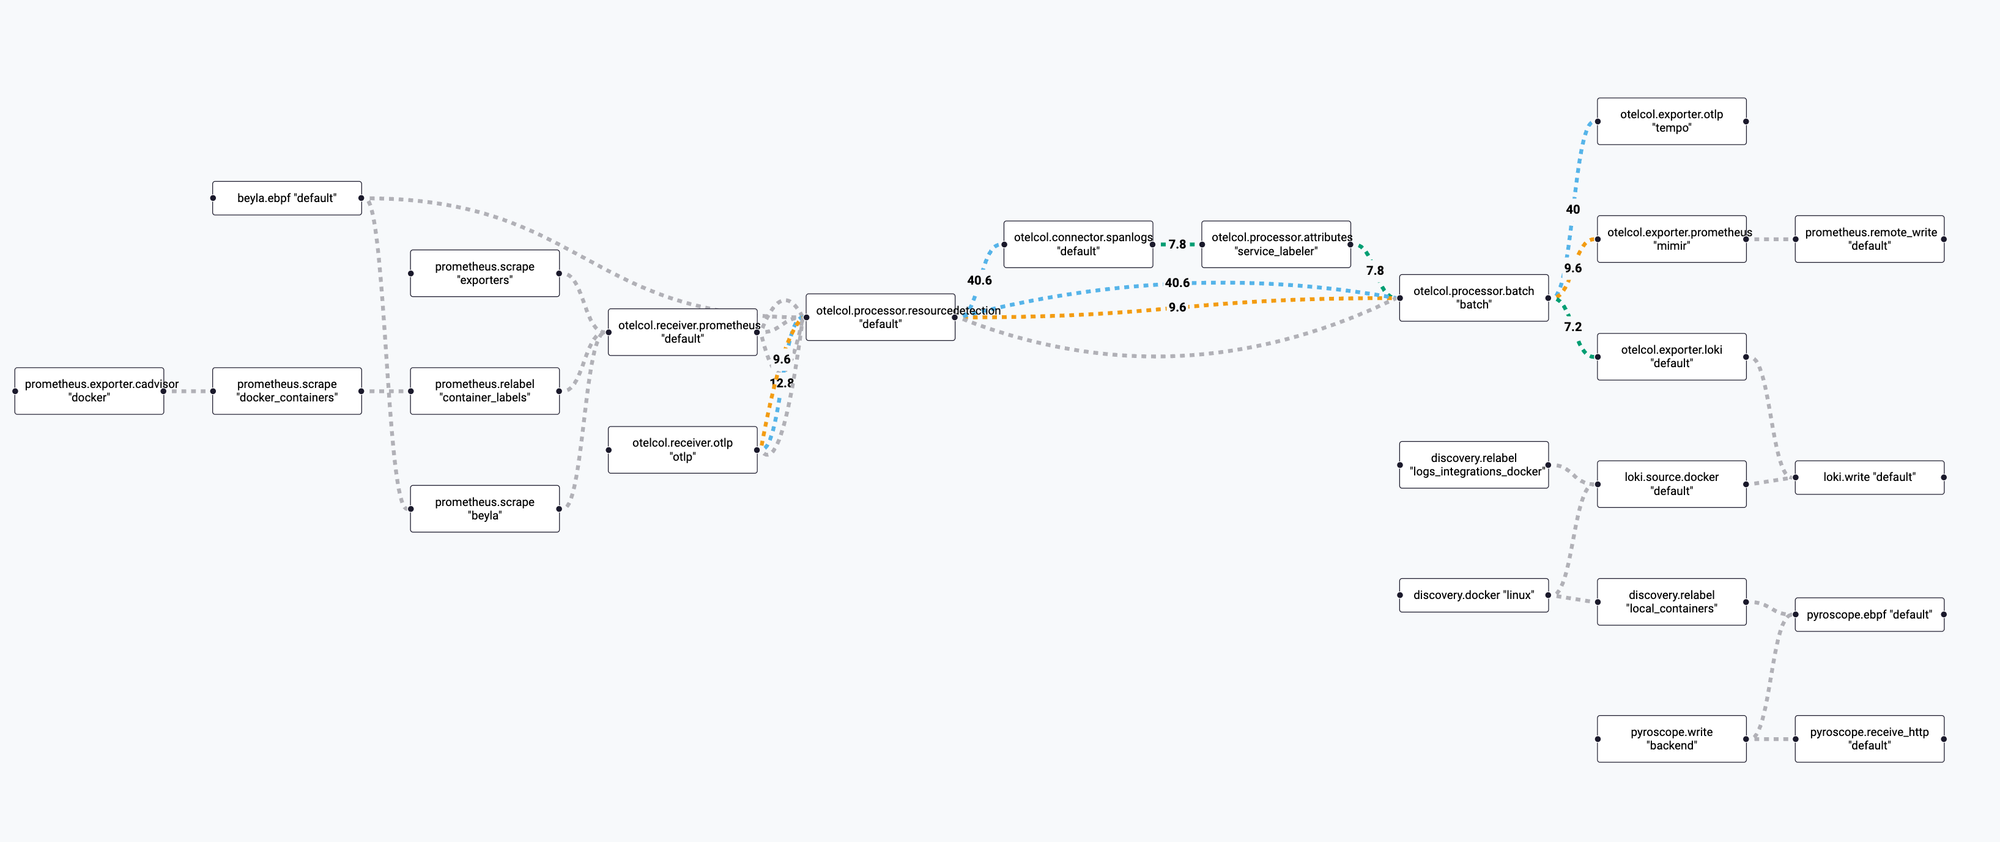
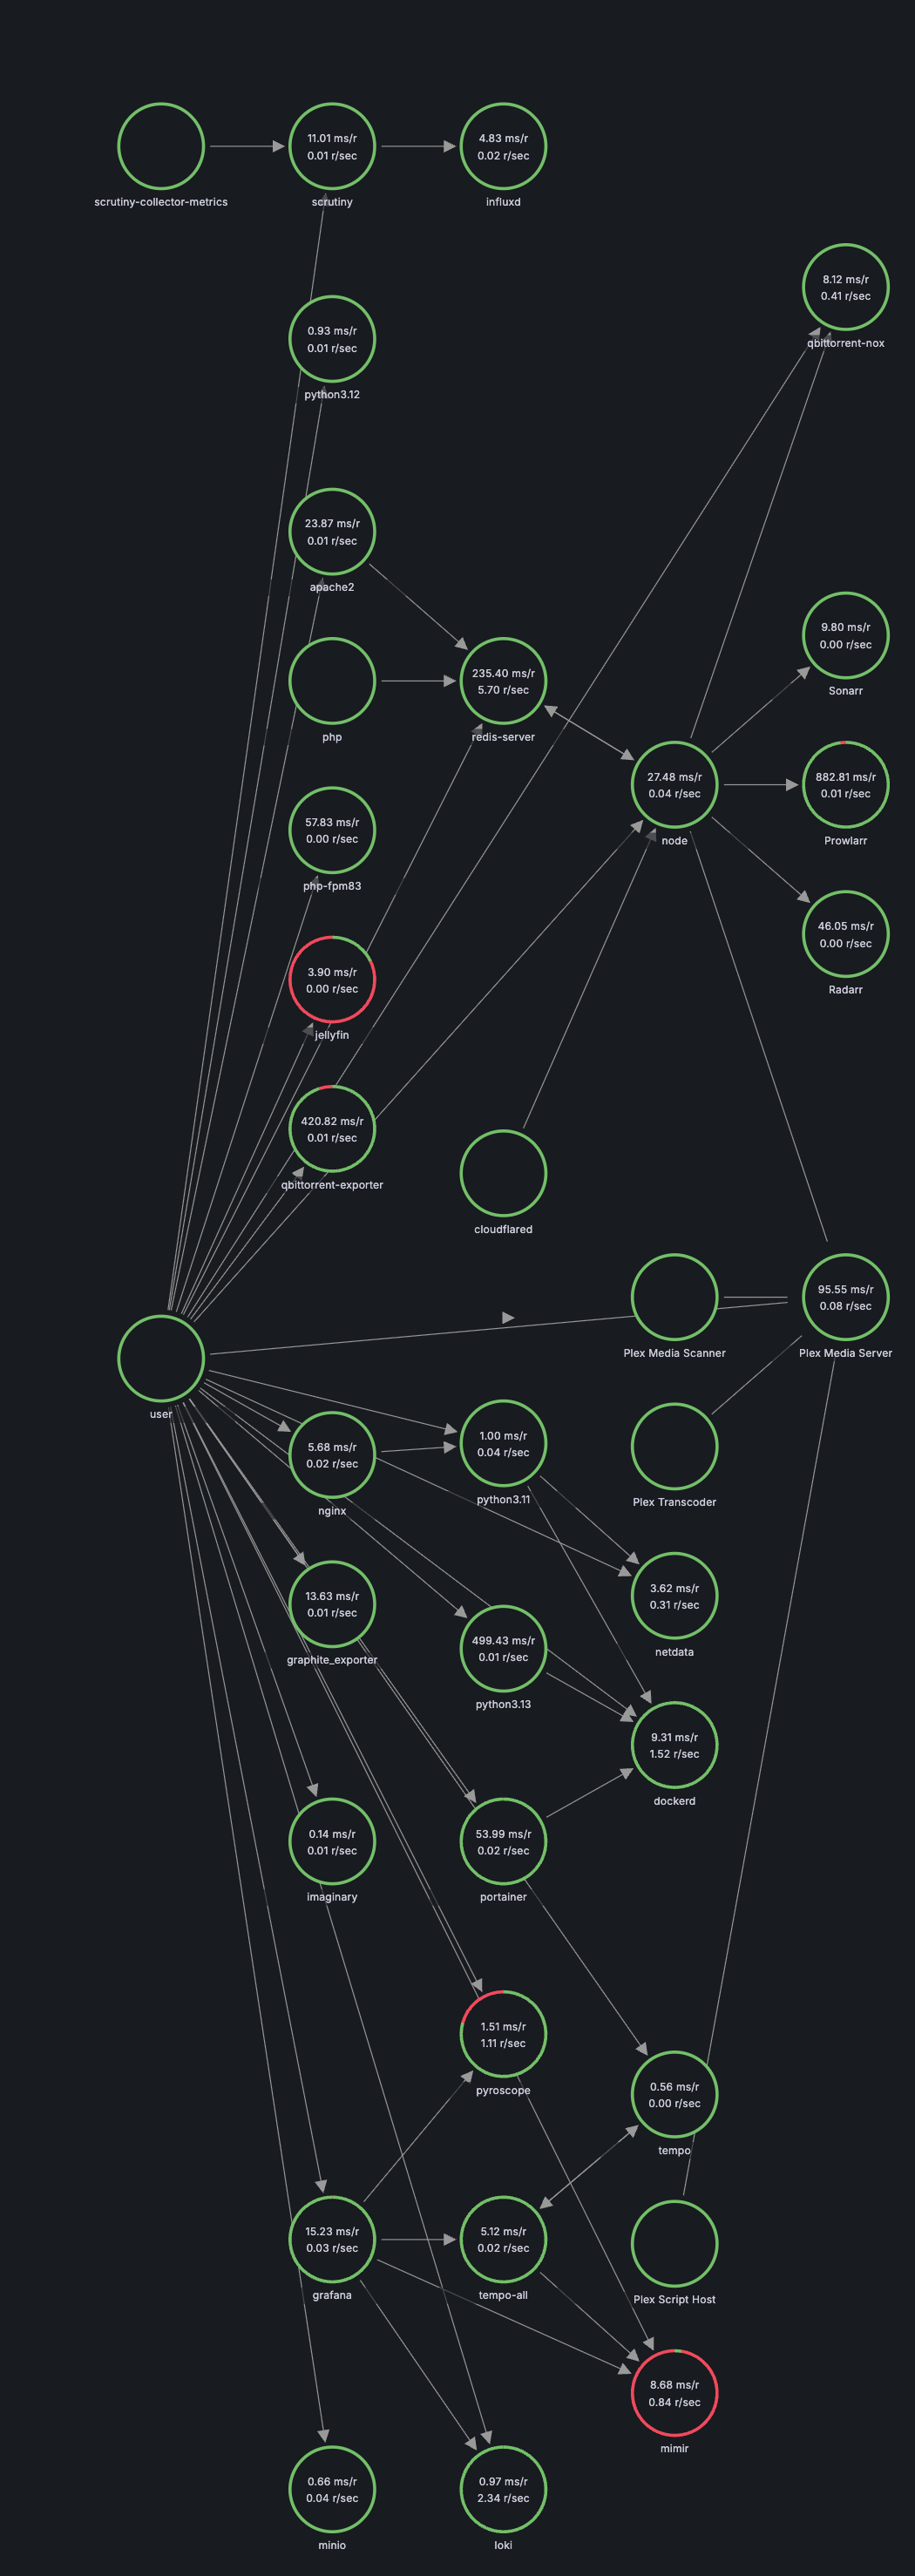
The real magic, however, lies in Grafana Alloy. Alloy is Grafana's distribution of the OpenTelemetry (OTel) Collector, but with powerful additions like its own configuration language and built-in components that simplify complex data pipelines. It's responsible for receiving telemetry from various sources, processing it, and routing it to the correct storage backend.
Here's a visual representation of the data flow through Alloy, which we'll be breaking down in detail:
The Heart of the System: Grafana Alloy
Alloy's configuration is a graph of interconnected components. Data flows from receivers, through processors and connectors, and finally out to exporters.
How Data Gets In: Receivers
My stack ingests data in several ways:
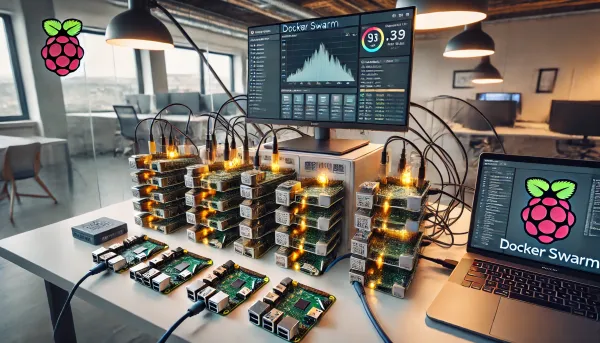
1. OTLP Endpoints: Alloy exposes standard OTel gRPC and HTTP endpoints. This allows any OTel-instrumented application to send telemetry directly. I use this for a separate Raspberry Pi cluster that pushes its data over the network.
// Grafana Services/alloy/config.alloy
// OpenTelemetry grpc and http receiver ports
otelcol.receiver.otlp "otlp" {
  grpc { }
  http { }

  output {
    traces  = [otelcol.processor.resourcedetection.default.input]
    metrics = [otelcol.processor.resourcedetection.default.input]
    logs    = [otelcol.processor.resourcedetection.default.input]
  }
}
2. Prometheus Scrapes: Alloy actively scrapes Prometheus metrics from various sources:
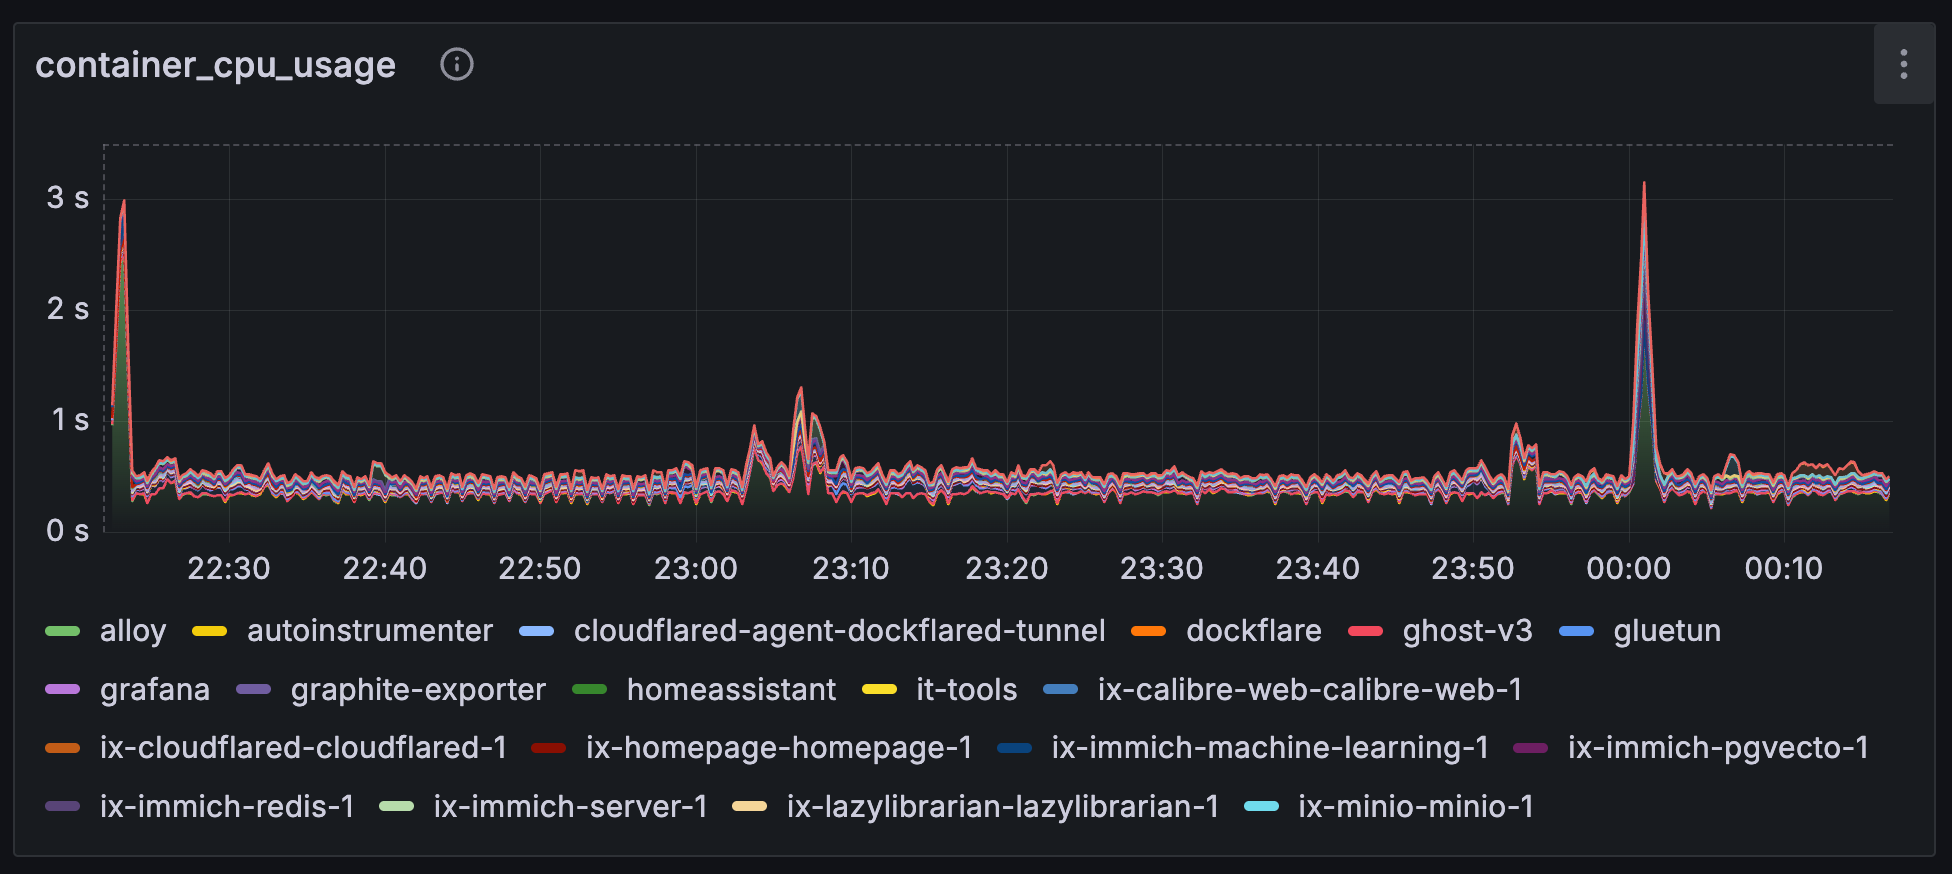
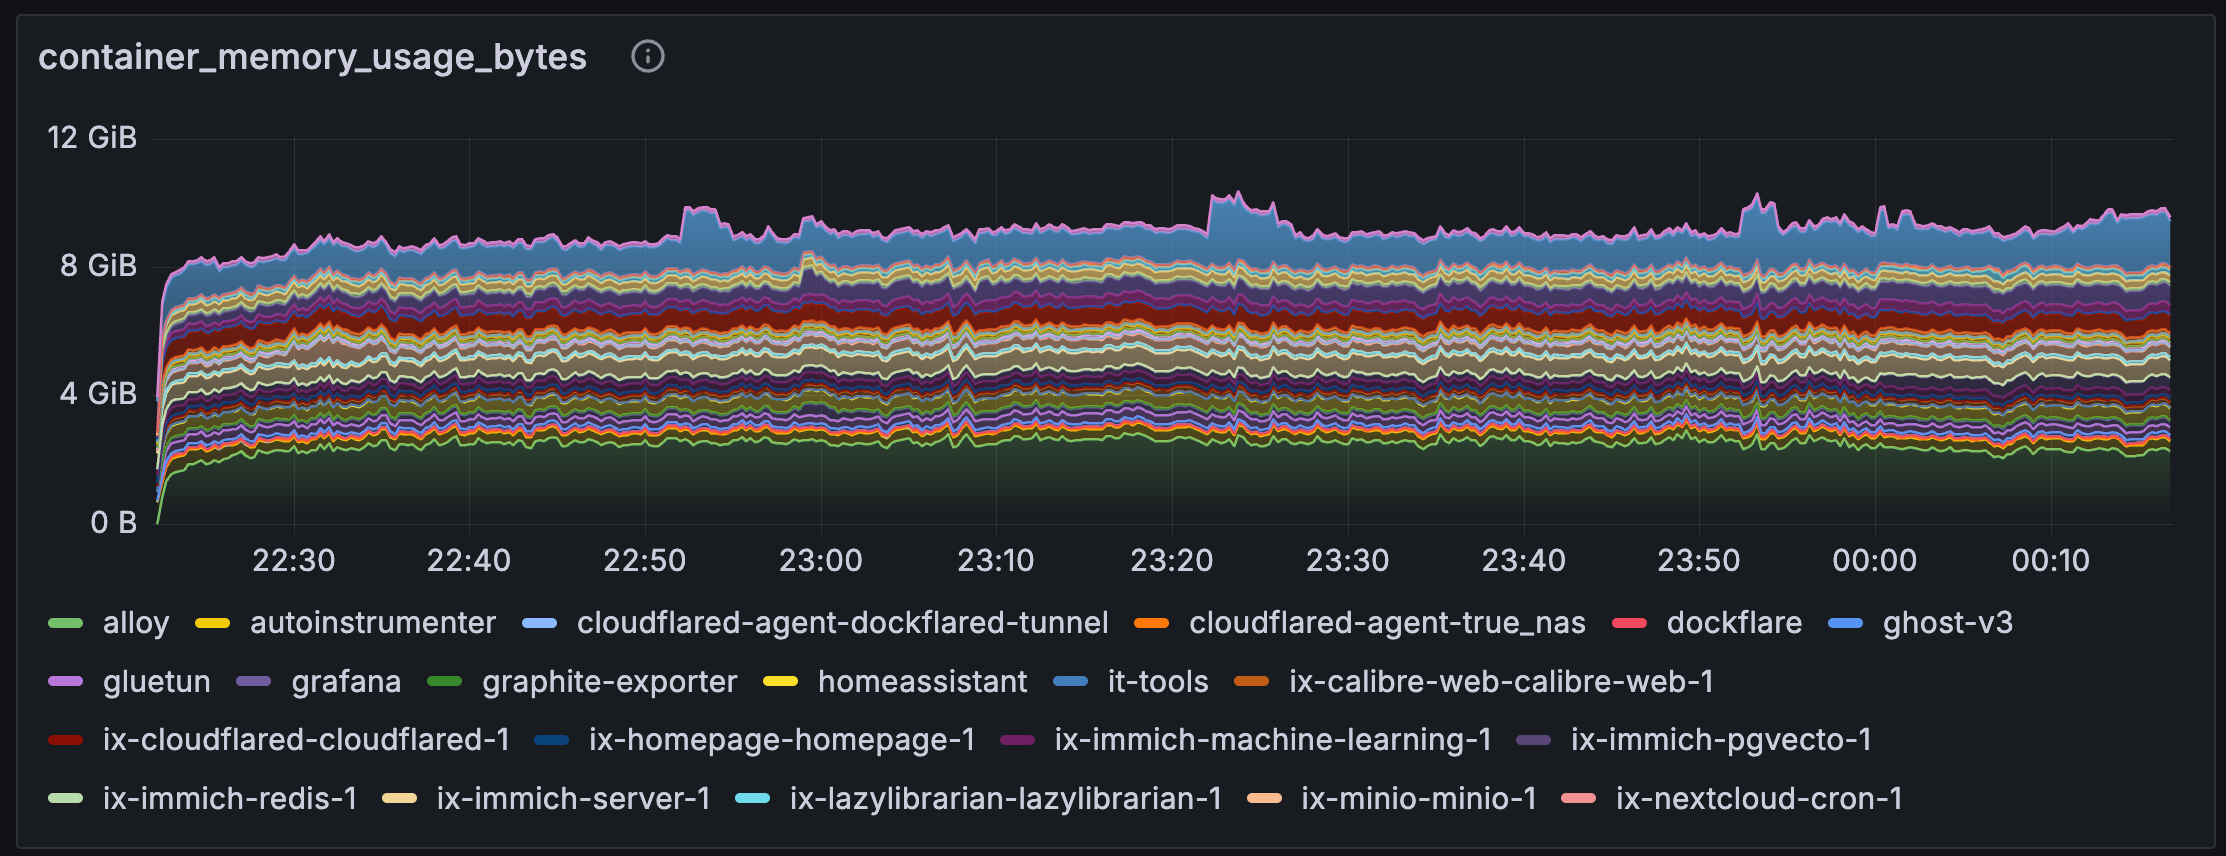
- cAdvisor: To get fine-grained container metrics (CPU, memory, network, etc.).
- Manual Endpoints: I scrape the LGTM components themselves (Mimir, Tempo, Loki) to monitor the monitoring stack.
- Graphite Exporter: TrueNAS exports metrics in the Graphite format. I use a dedicated
graphite-exportercontainer to convert these to Prometheus format, which Alloy then scrapes.
// Grafana Services/alloy/config.alloy
// "Pull" metrics from specific exporters
prometheus.scrape "exporters" {
  targets = [
    {"__address__" = "graphite-exporter:9108"},
    {"__address__" = "mimir:9090"},
    {"__address__" = "tempo:3200"},
    {"__address__" = "loki:3100"},
  ]

  forward_to = [otelcol.receiver.prometheus.default.receiver]
}
3. eBPF for Automatic Instrumentation: This is one of the most powerful features. Using eBPF, Alloy can automatically trace requests and generate profiles for running containers without any code changes.
- Beyla (
beyla.ebpf): Sits at the Linux kernel level, observing network traffic between containers. It automatically generates traces and metrics for HTTP requests, propagating trace IDs across services. - Pyroscope (
pyroscope.ebpf): Does the same for continuous profiling, capturing CPU profiles from all containers.
This is a game-changer because it provides deep visibility into third-party applications or legacy services where you can't modify the source code to add manual instrumentation.
How Data is Processed: Processors & Connectors
Once data is received, it flows through a processing pipeline:
- Resource Detection: The
otelcol.processor.resourcedetectioncomponent automatically attaches metadata like hostname and OS to all incoming telemetry. I haveoverride = falseset to ensure that telemetry from my Raspberry Pi cluster retains its original host information. - Span-to-Log Conversion: The
otelcol.connector.spanlogscomponent is a neat trick. It inspects traces and generates a log entry for the root span of each trace. This means that for every incoming request captured by Beyla, I get a corresponding log line with the HTTP method, status code, and trace ID, even if the application itself doesn't log it. - Batching: Finally, the
otelcol.processor.batchcomponent groups telemetry together before sending it to the exporters. This is more efficient than sending a network request for every single log or metric, especially in a busy system.
Relabeling: For discovered Docker containers, I use discovery.relabel to clean up the container name and use it as the service_name label, which is a standard across the observability world.
// Grafana Services/alloy/config.alloy
discovery.relabel "local_containers" {
  targets = discovery.docker.linux.targets

  rule {
    action        = "replace"
    source_labels = ["__meta_docker_container_name"]
    regex         = "^/(.*)"
    replacement   = "$1"
    target_label  = "service_name"
  }
}
Component Deep Dive
Now let's look at how each backend storage component is configured to work with Alloy.
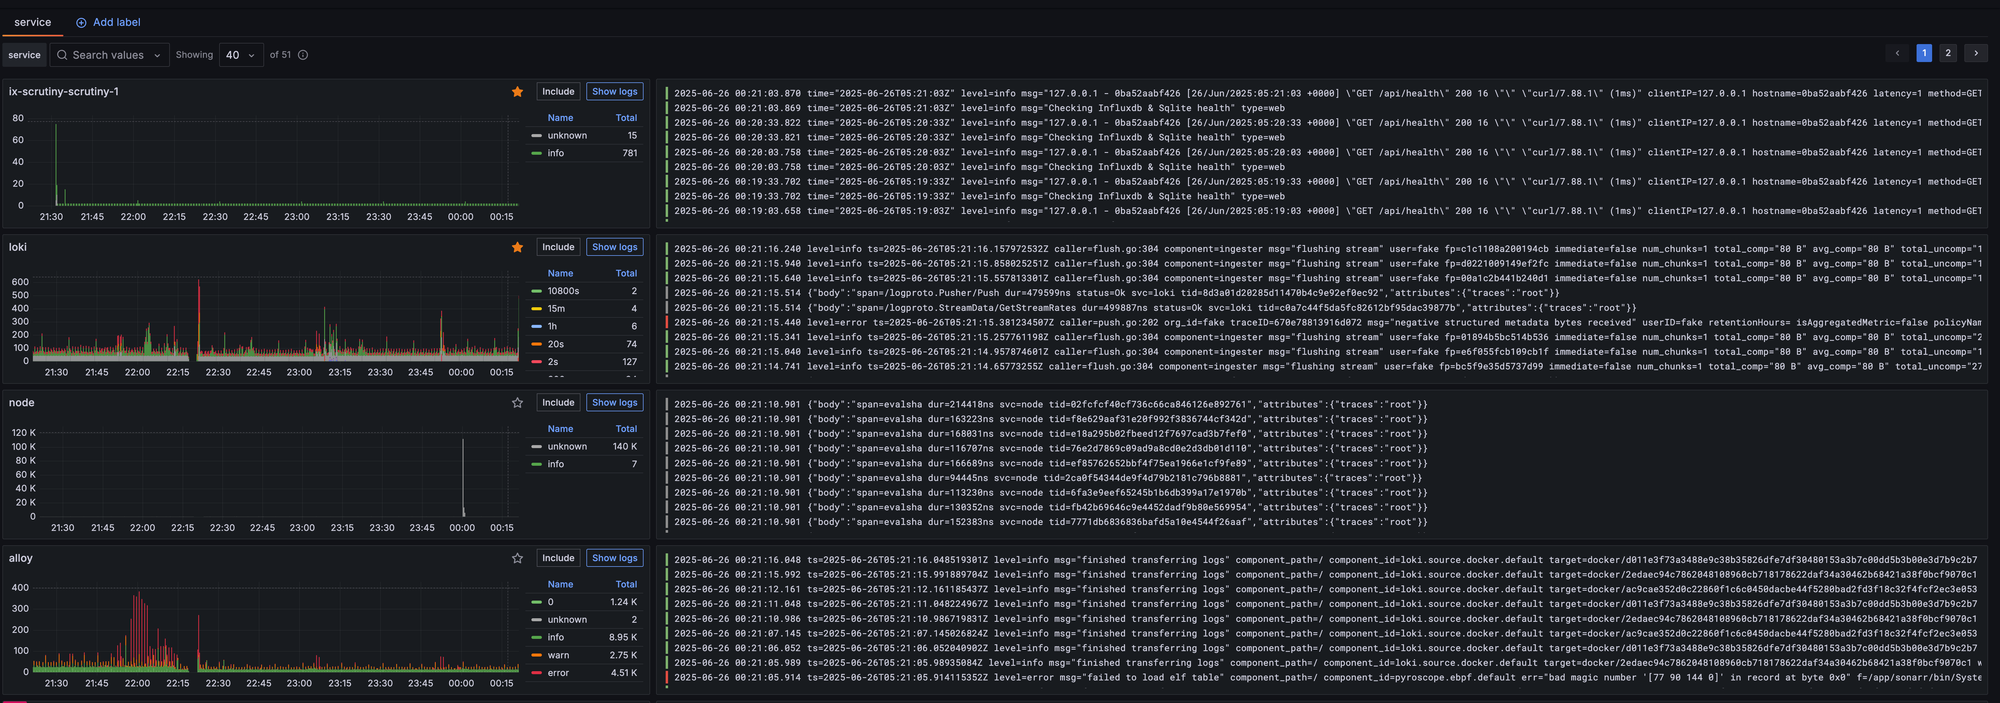
Logging with Loki
Loki receives logs from two primary sources via Alloy:
- Directly from container
stdout: Alloy'sloki.source.dockercomponent uses the Docker socket to discover all running containers and stream their logs, just like runningdocker logs. - From the OTel endpoint: Any service can push structured logs directly to Alloy.
A crucial piece of configuration in Loki itself is ensuring it recognizes the service_name label we attached in Alloy. The discover_service_name block tells Loki which attributes to look for to identify the service.
# Grafana Services/loki/loki-config.yaml
limits_config:
  # ...
  discover_service_name:
    - svc
    - service_name
    - service
    - app
Metrics with Mimir
Mimir is my store for Prometheus-compatible metrics. Since this is a single-node home lab setup, I've disabled multi-tenancy and configured it to use the local filesystem for storage. I also bumped up some of the default limits to handle the initial burst of metrics when services restart.
# Grafana Services/mimir/mimir.yaml
multitenancy_enabled: false

common:
  storage:
    backend: filesystem
    filesystem:
      dir: /data/common

limits:
  ingestion_burst_size: 1000000     # 5x the default
  max_global_series_per_user: 1000000
Tracing with Tempo & Automatic Service Graphs
Tempo stores and queries traces. One of the neat features I've enabled is having Tempo generate its own service graphs and span metrics. I initially tried to do this within Alloy, but it was unstable and crashed frequently. The official recommendation is to let Tempo handle it, and it works well.
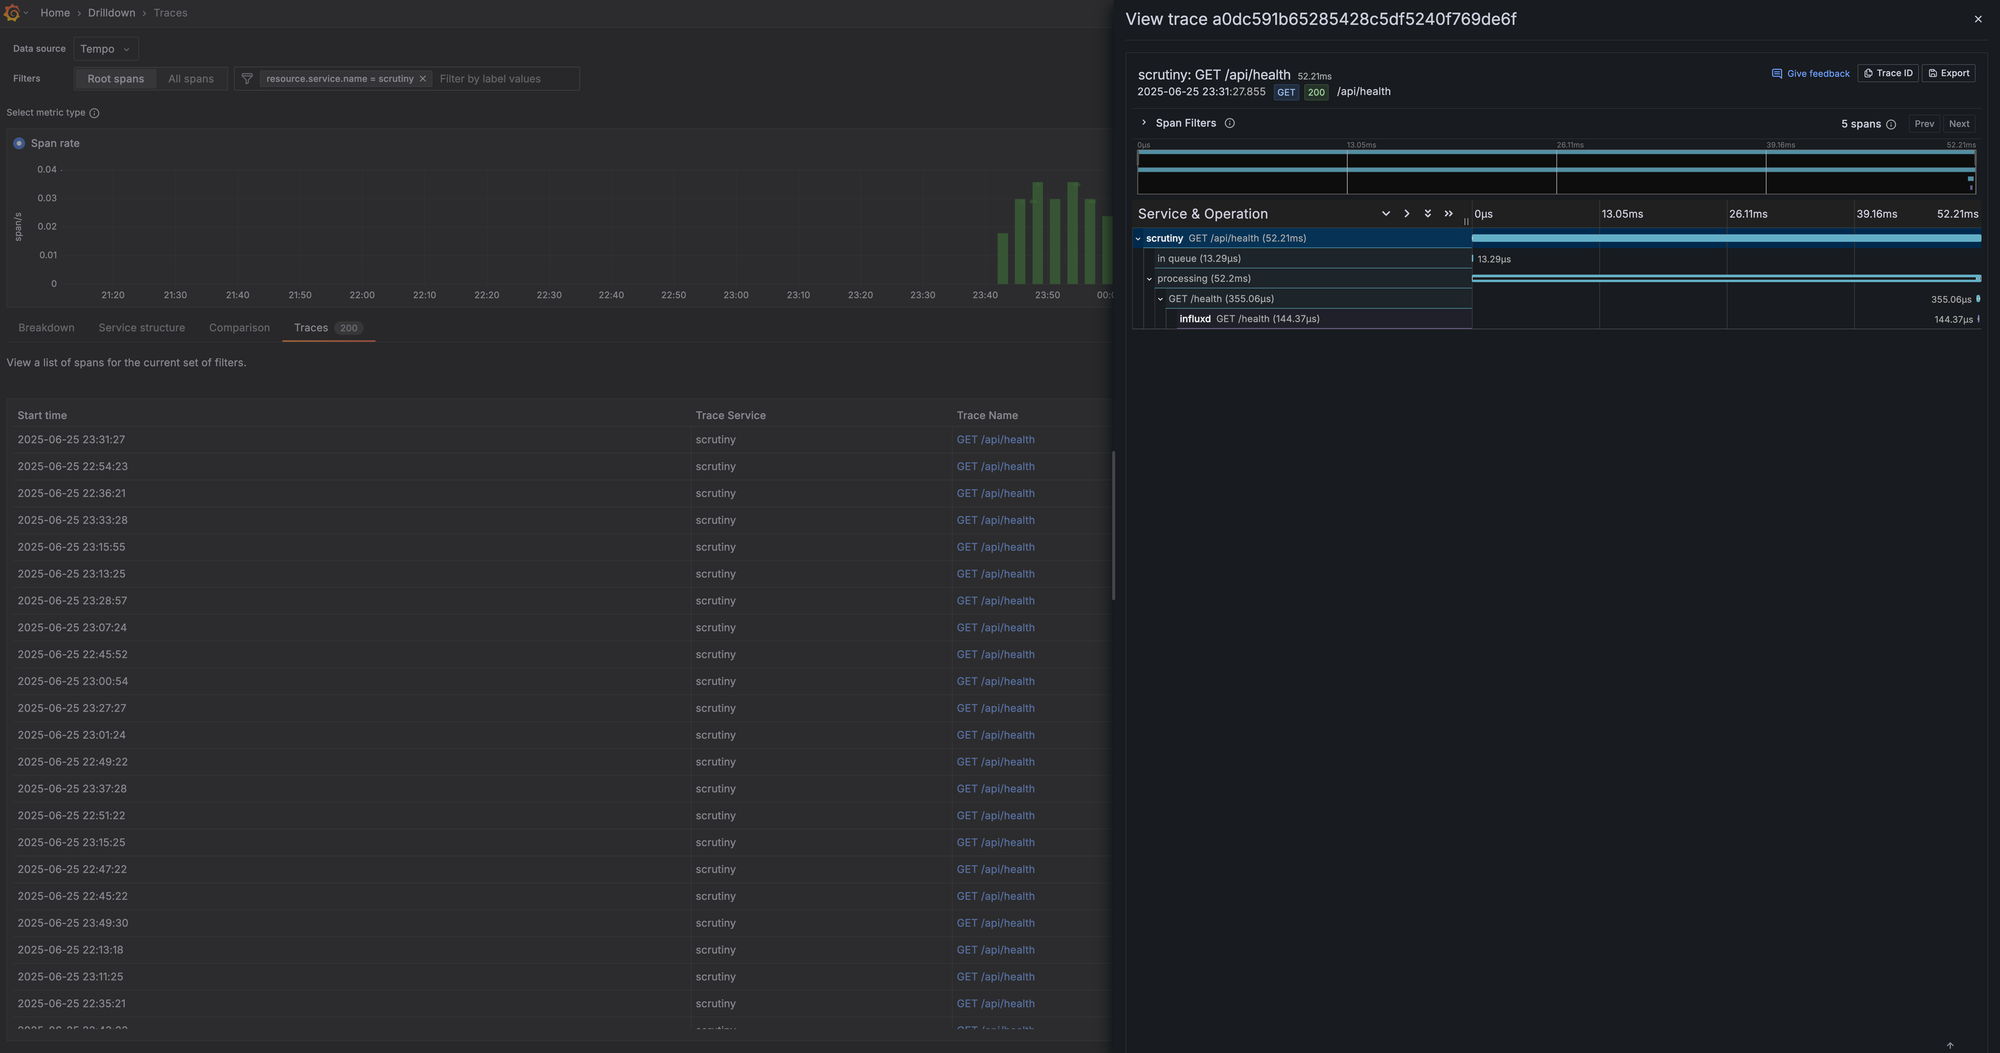
Tempo processes the traces it receives, generates metrics (e.g., "service A called service B," request latency, error counts), and then writes those metrics directly to Mimir.
# Grafana Services/tempo/tempo.yaml
metrics_generator:
  # ...
  storage:
    path: /data/generator/wal
    # pushes prometheus metrics to Mimir
    remote_write:
      - url: http://mimir:9090/api/v1/push
        send_exemplars: true

overrides:
  defaults:
    metrics_generator:
      processors: [service-graphs, span-metrics, local-blocks]
This is a powerful feedback loop: traces come into Tempo, which generates metrics and sends them to Mimir, all of which can be correlated in Grafana.
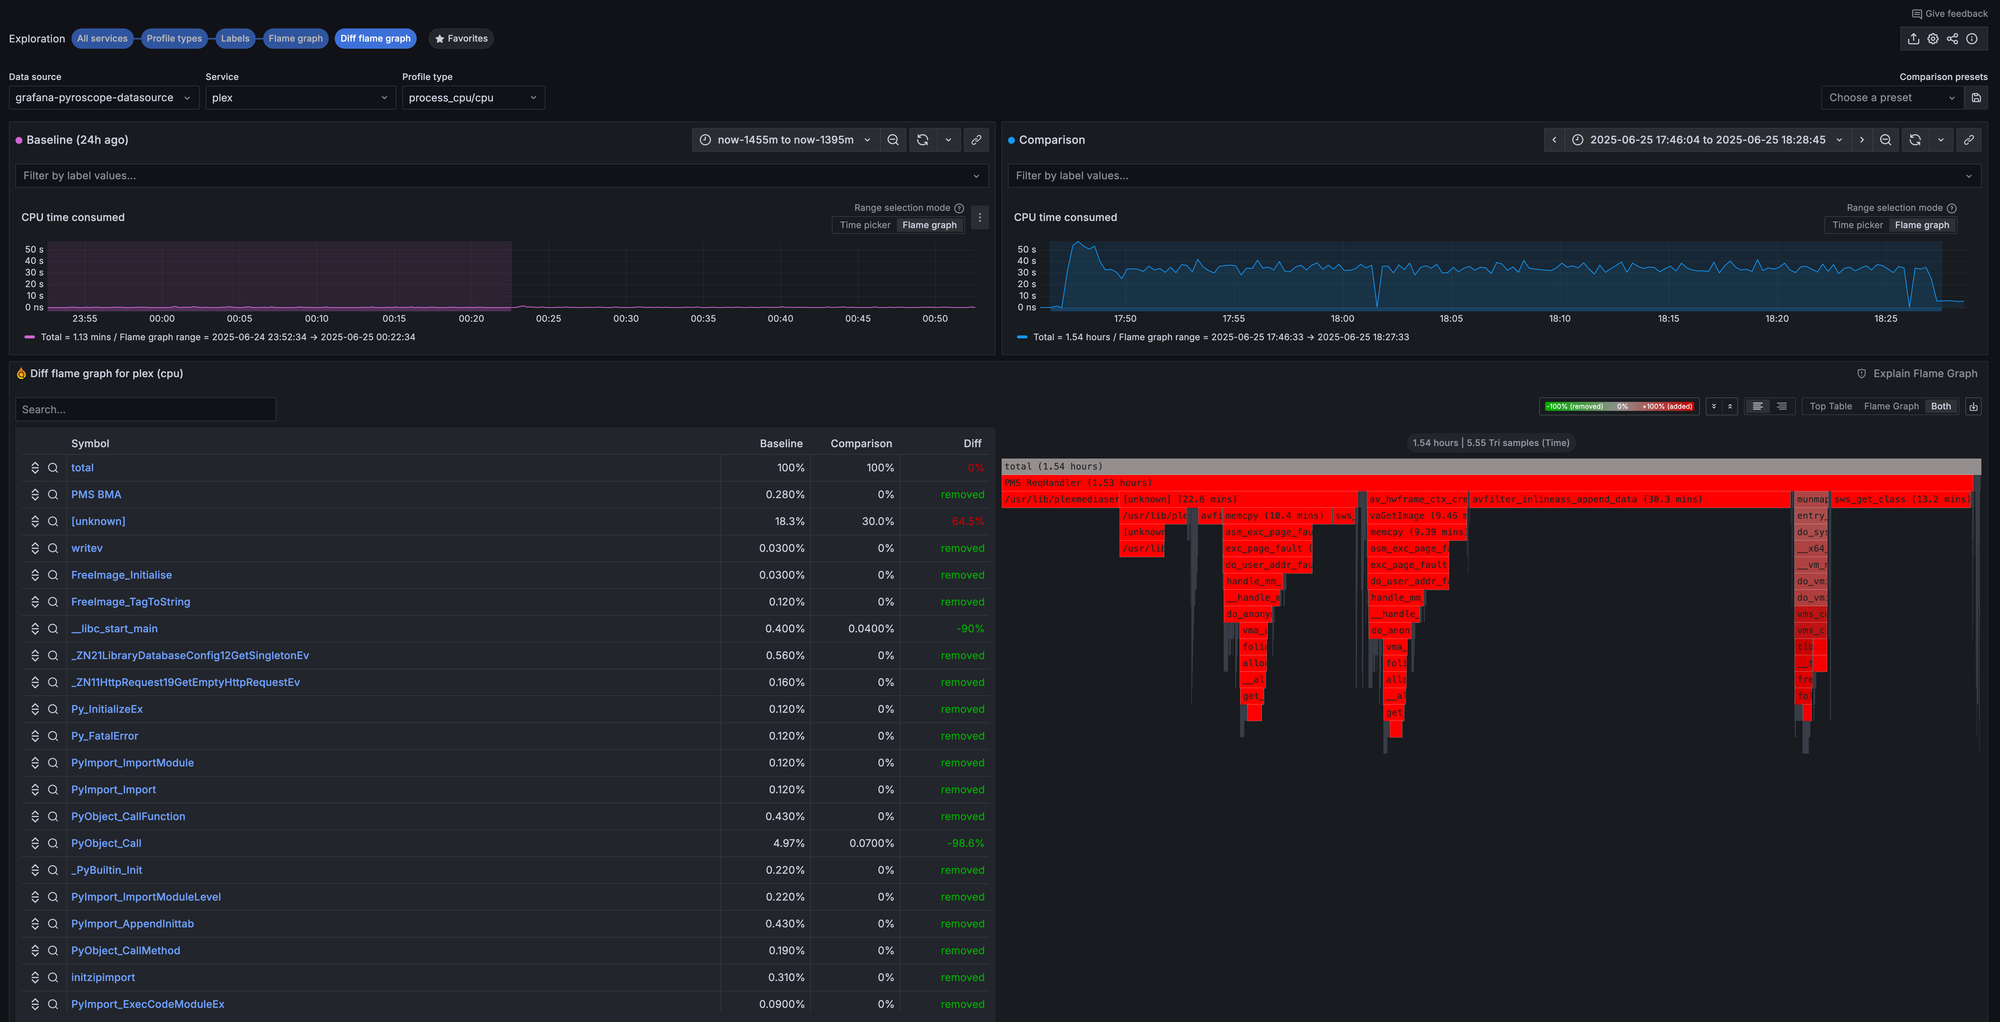
Profiling with Pyroscope
Pyroscope stores continuous profiling data. Thanks to the pyroscope.ebpf component in Alloy, I get CPU profiles for every running container automatically. This is incredibly useful for debugging performance issues. Grafana allows you to compare profiles from different time ranges, so you can see a diff between a "busy" period and an "idle" one to pinpoint exactly what code paths are causing high CPU usage.
Putting it All Together: Docker Compose
All of these services are orchestrated with a single docker-compose.yml file. The alloy service definition is the most complex, as it requires special permissions for eBPF and cAdvisor to work.
services:
  alloy:
    image: grafana/alloy:v1.9.1
    container_name: alloy
    command: ["run", "/etc/alloy/config.alloy", "--server.http.listen-addr=0.0.0.0:12345", "--stability.level=experimental"]
    privileged: true # Required for eBPF profiling
    pid: "host" # Required for eBPF profiling
    volumes:
      - /mnt/storage_pool/docker/appdata/grafana/services/alloy/config.alloy:/etc/alloy/config.alloy
      - /var/run/docker.sock:/var/run/docker.sock:ro
       # allows cAdvisor to read container metadata
      - /:/rootfs:ro
      - /var/run:/var/run:ro
      - /sys:/sys:ro
      - /var/lib/docker/:/var/lib/docker:ro
    ports:
      - "12345:12345" # Debugging UI
      - "4317:4317"   # OTLP gRPC
      - "4318:4318"   # OTLP HTTP
Key takeaways here:
--stability.level=experimental: This flag is required to enable the eBPF components.privileged: trueandpid: "host": These grant Alloy the necessary kernel-level access for eBPF.- Volume Mounts: We mount the Docker socket for container discovery and several read-only host paths for cAdvisor to access container stats.
Final Thoughts
Setting up this stack was a significant investment of time and effort. The configuration is complex, and the components have many moving parts. However, the result is an incredibly powerful and tightly integrated observability platform that gives me deep insights into everything running on my server, often with zero instrumentation effort.
For anyone who wants full control and is willing to get their hands dirty, this is a fantastic learning experience and a powerful tool. For everyone else, I'd still recommend looking at a more managed solution like SigNoz to save yourself the 40+ hours of configuration. But for me, the journey was worth it.